Digital marketing is an integral part of modern business strategies, and without tracking performance through analytics and reporting, you might be flying blind. Whether you’re running ads, creating content, or growing your email list, data is crucial for measuring success and guiding decisions. In this article, we will explore how analytics and reporting play a vital role in digital marketing campaigns, provide practical examples, and offer actionable tips to improve your marketing strategy.
Why Analytics and Reporting Matter

Before diving into the details, let’s clarify why analytics and reporting are essential for digital marketing:
- Measure Campaign Performance: Data helps you understand how well your campaigns are performing. You can track metrics like click-through rates, conversions, and bounce rates to see if you’re hitting your goals.
- Optimize Efforts: Analytics allows you to identify what works and what doesn’t. If a particular ad is performing poorly, you can tweak it for better results, optimizing your budget allocation and content strategy.
- Data-Driven Decisions: With the insights from analytics, you can make informed decisions, rather than relying on assumptions or guesswork. This means that your marketing strategies will be more targeted and effective.
- Prove ROI: Reporting allows you to show the return on investment (ROI) for marketing campaigns, making it easier to justify marketing spends to stakeholders and clients.
Key Metrics to Track for Digital Marketing Campaigns
Effective reporting starts with identifying the right metrics. Here are some crucial metrics you should consider when analyzing your digital marketing campaigns:
1. Website Traffic

Website traffic is one of the most basic yet important metrics. It shows how many people visit your website as a result of your marketing efforts. This includes direct traffic, referral traffic, organic search, and social media traffic.
Example:
If you’ve been running a Facebook ad campaign, you can track the number of visitors coming to your website directly from the ad. High traffic indicates that your ad is attracting attention.
2. Conversion Rate

Conversion rate refers to the percentage of visitors who complete a desired action, such as making a purchase, signing up for a newsletter, or filling out a contact form.
Example:
If you’re running a lead generation campaign, you can track how many visitors from your ads sign up for your newsletter. If you see that your conversion rate is low, you can optimize the landing page, adjust your call to action, or revise the ad copy.
3. Cost Per Acquisition (CPA)
CPA is a metric that calculates how much it costs to acquire a new customer or lead. This helps in understanding the effectiveness of paid advertising campaigns.
Example:
You’ve spent $100 on a Google Ads campaign, and you’ve acquired 10 customers. Your CPA would be $10. This metric helps you assess whether the investment is worthwhile and what you should aim for in future campaigns.
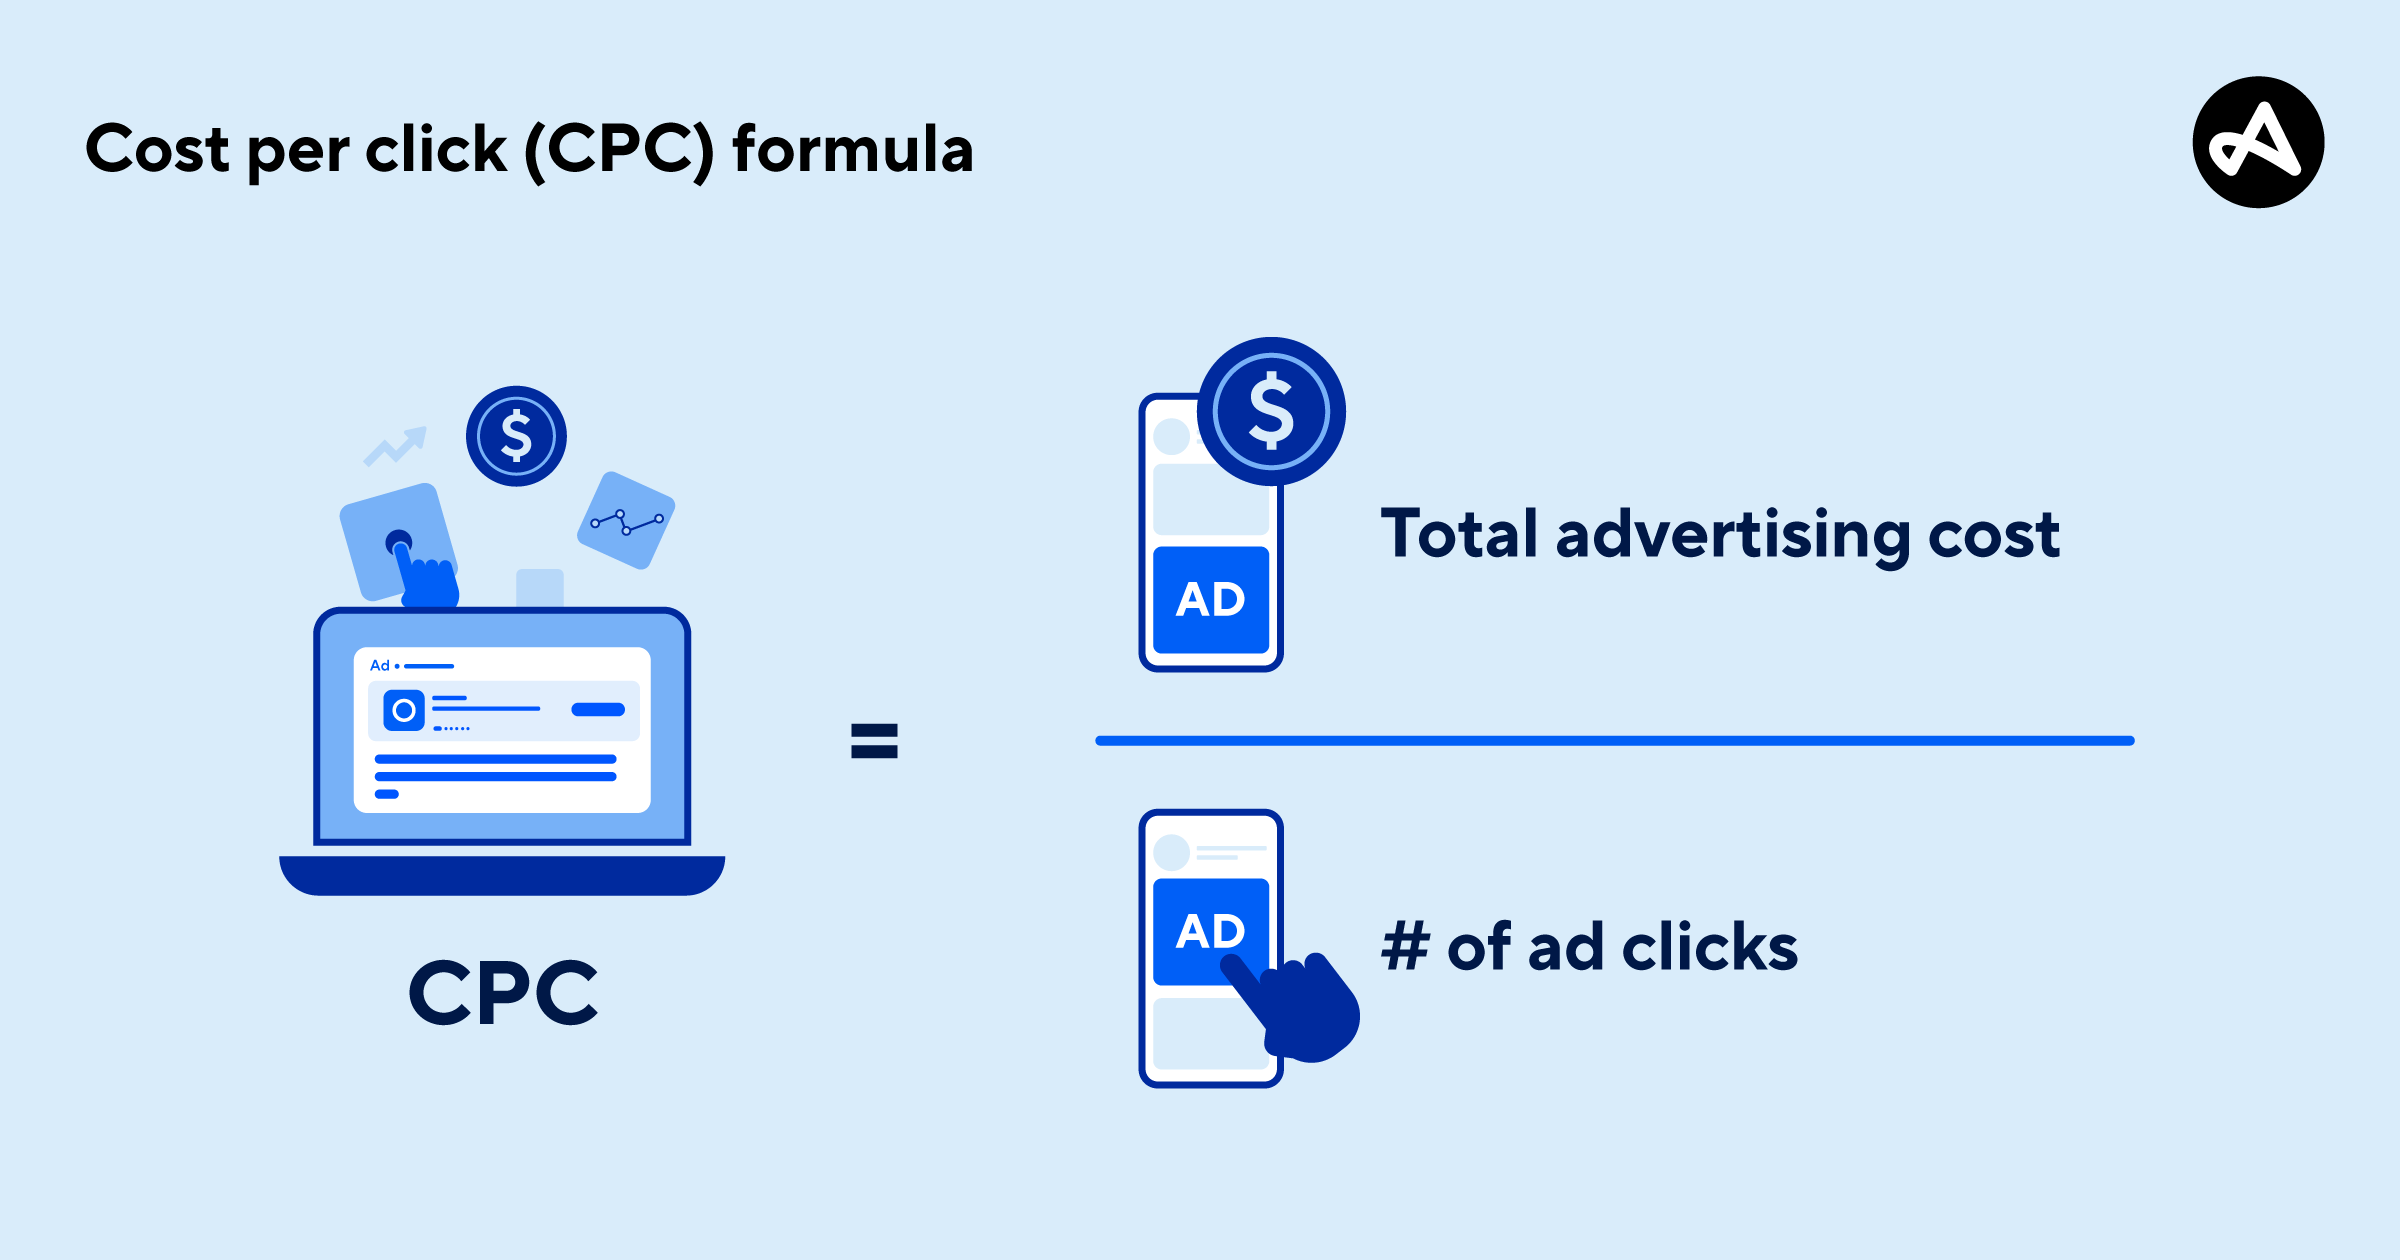
4. Click-Through Rate (CTR)

CTR is the percentage of people who click on an ad or link compared to the number of people who saw it. A high CTR indicates that your ads are relevant and appealing to your audience.
Example:
If you’re running a banner ad, a CTR of 5% means that 5% of the people who saw the ad clicked on it. This metric is particularly important for paid advertising campaigns.
5. Return on Ad Spend (ROAS)

ROAS measures the revenue generated for every dollar spent on advertising. This metric is critical for understanding the profitability of your campaigns.
Example:
If you’ve spent $500 on a Google Ads campaign and generated $2000 in sales, your ROAS would be 4:1. A ROAS above 1 indicates that your campaigns are profitable.
Tools for Digital Marketing Analytics and Reporting
To effectively track and report on the performance of your digital marketing campaigns, it’s essential to use the right tools. Here are some popular analytics tools:
- Google Analytics:
Google Analytics is one of the most widely used tools for tracking website performance. It provides detailed insights into website traffic, user behavior, conversions, and more. You can also set up goals and track events to measure conversions. Tip: Set up custom reports in Google Analytics to track campaign-specific data, such as the number of users coming from specific marketing channels (social media, email, paid ads). - Facebook Ads Manager:
For campaigns run on Facebook or Instagram, Ads Manager is an invaluable tool. It allows you to track key metrics like CTR, CPA, ROAS, and more. Tip: Use the A/B testing feature in Ads Manager to test different ad creatives and audiences, helping you optimize your ads for better performance. - HubSpot:
HubSpot offers comprehensive tools for tracking marketing efforts, from social media engagement to email campaign performance. It’s especially useful for inbound marketing strategies. - Google Data Studio:
Google Data Studio allows you to create custom dashboards that visualize your marketing data from Google Analytics, Google Ads, and other sources. This can make reporting more intuitive and accessible for clients or stakeholders. Tip: Create automated reports in Google Data Studio, so you don’t have to manually generate reports every time you want to assess performance.
Best Practices for Reporting on Digital Marketing Campaigns
Once you have your data and metrics in place, the next step is presenting the findings in a way that is actionable and understandable. Here are some best practices for reporting:
1. Define Your Objectives

Before creating a report, define the objectives of the campaign. What were you trying to achieve? Whether it was to increase sales, generate leads, or build brand awareness, knowing the goal will guide your analysis and reporting.
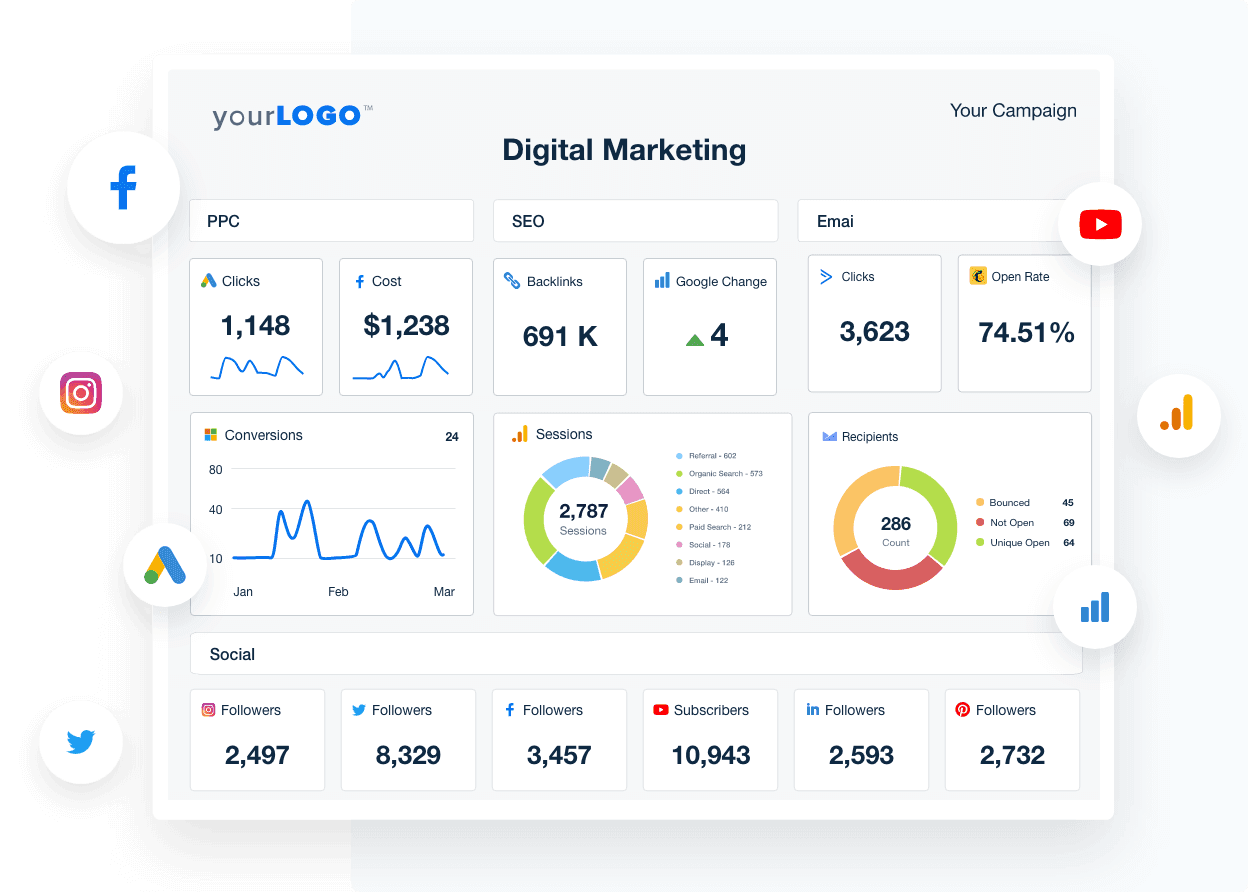
2. Use Visualizations

Data can be overwhelming, so use charts, graphs, and tables to make your reports visually appealing and easy to digest. For example, you can present traffic growth through a line graph or display conversion rates with pie charts.
Image suggestion: Use a chart of a campaign’s performance over time. Place it right after discussing the importance of defining your objectives.
3. Highlight Key Insights

Don’t just present raw data. Instead, highlight key insights that offer actionable takeaways. For example, if a campaign’s CTR is low, suggest a few adjustments to improve it. Include recommendations for improving underperforming areas.
4. Track Metrics Over Time
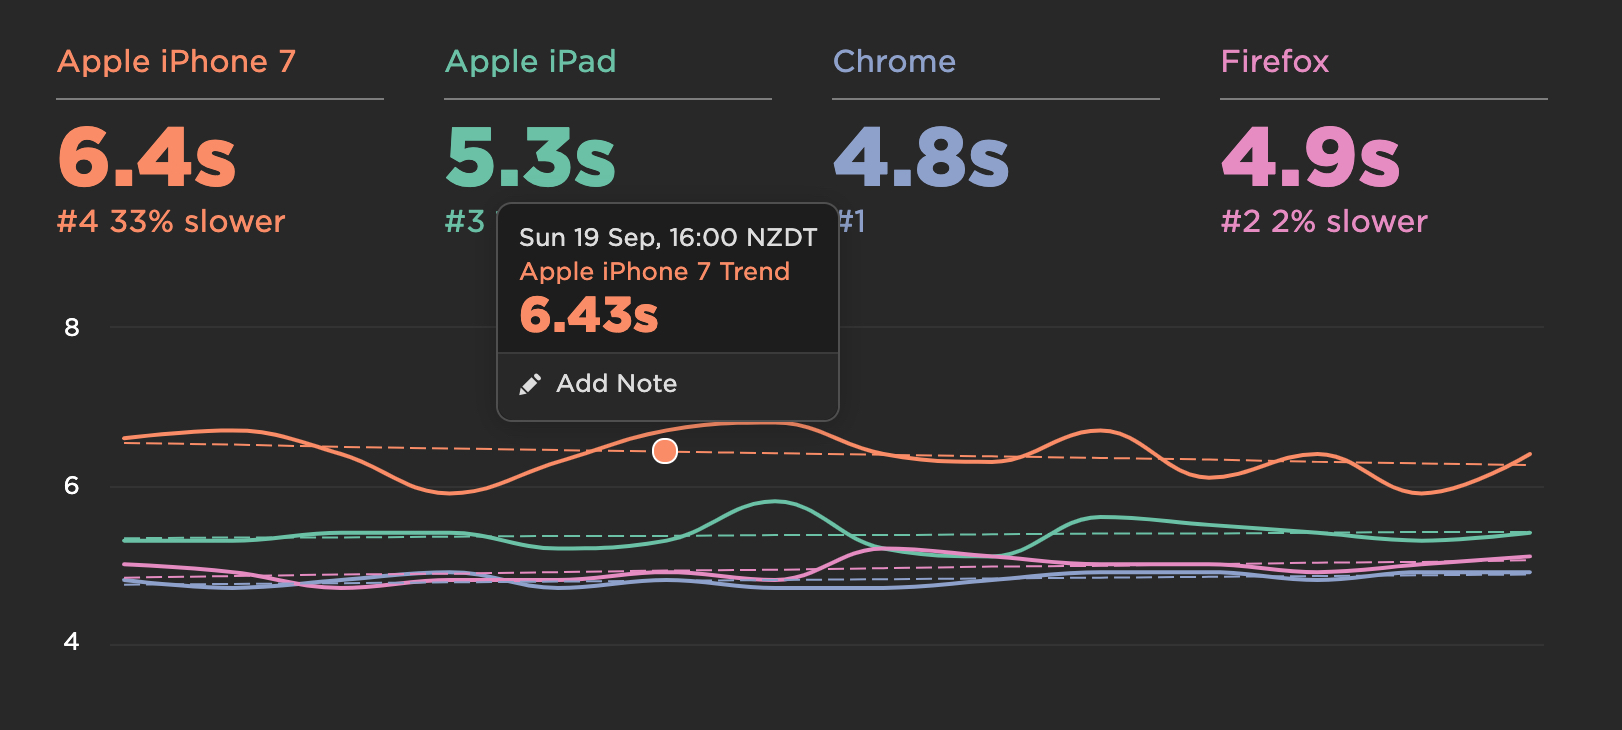
Digital marketing is an ongoing process, so it’s important to track metrics over time. Compare campaign performance month-over-month or quarter-over-quarter to assess trends and improvements.
Actionable Tips for Improving Analytics and Reporting
- Set Up Goals in Google Analytics:
By setting up goals (like form submissions or product purchases), you can track conversions more effectively. - Use UTM Parameters:
For more accurate campaign tracking, use UTM parameters in your URLs to track traffic sources and measure the effectiveness of different campaigns. - Test, Test, Test:
Continuously optimize your campaigns based on analytics. Run A/B tests to compare different ads, landing pages, or email copy to see what works best. - Automate Reporting:
Set up automated reports in tools like Google Data Studio to save time and ensure that you’re always up-to-date with campaign performance.
Conclusion
Analytics and reporting are integral to the success of digital marketing campaigns. By tracking the right metrics and using the right tools, you can make data-driven decisions that lead to more successful campaigns. Remember to focus on your objectives, analyze trends, and always look for areas to improve. With a solid understanding of analytics and reporting, you’ll be able to optimize your marketing strategies and achieve your goals more effectively.